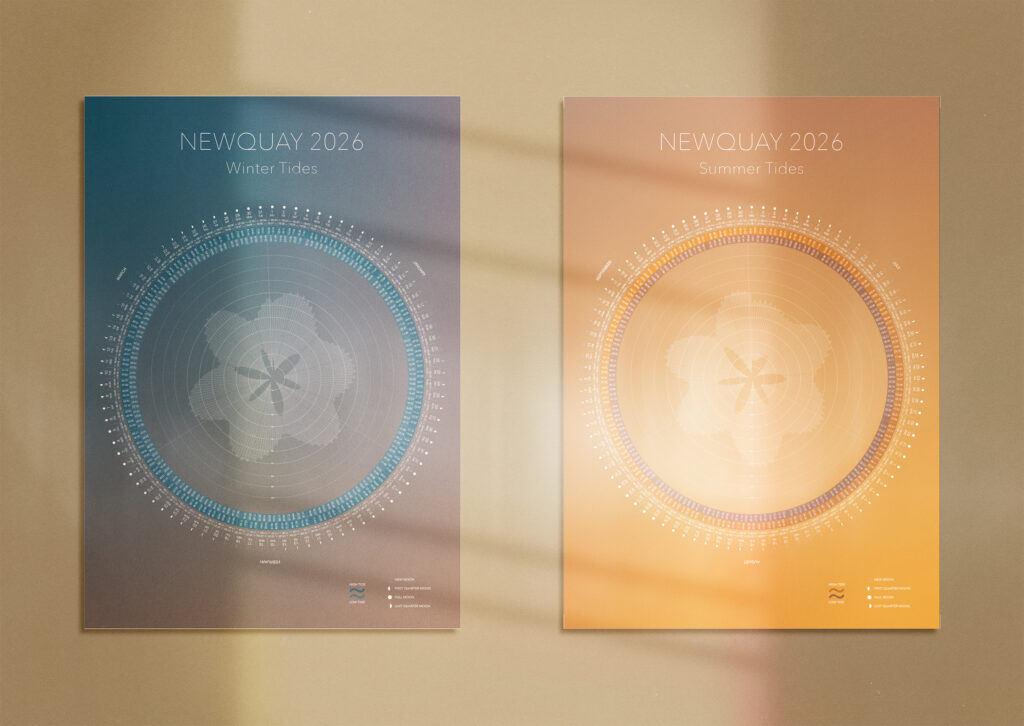
Tide times, moon phases, daylight hours, and tide heights at a glance. An intuitive infographic to help plan your costal adventures.
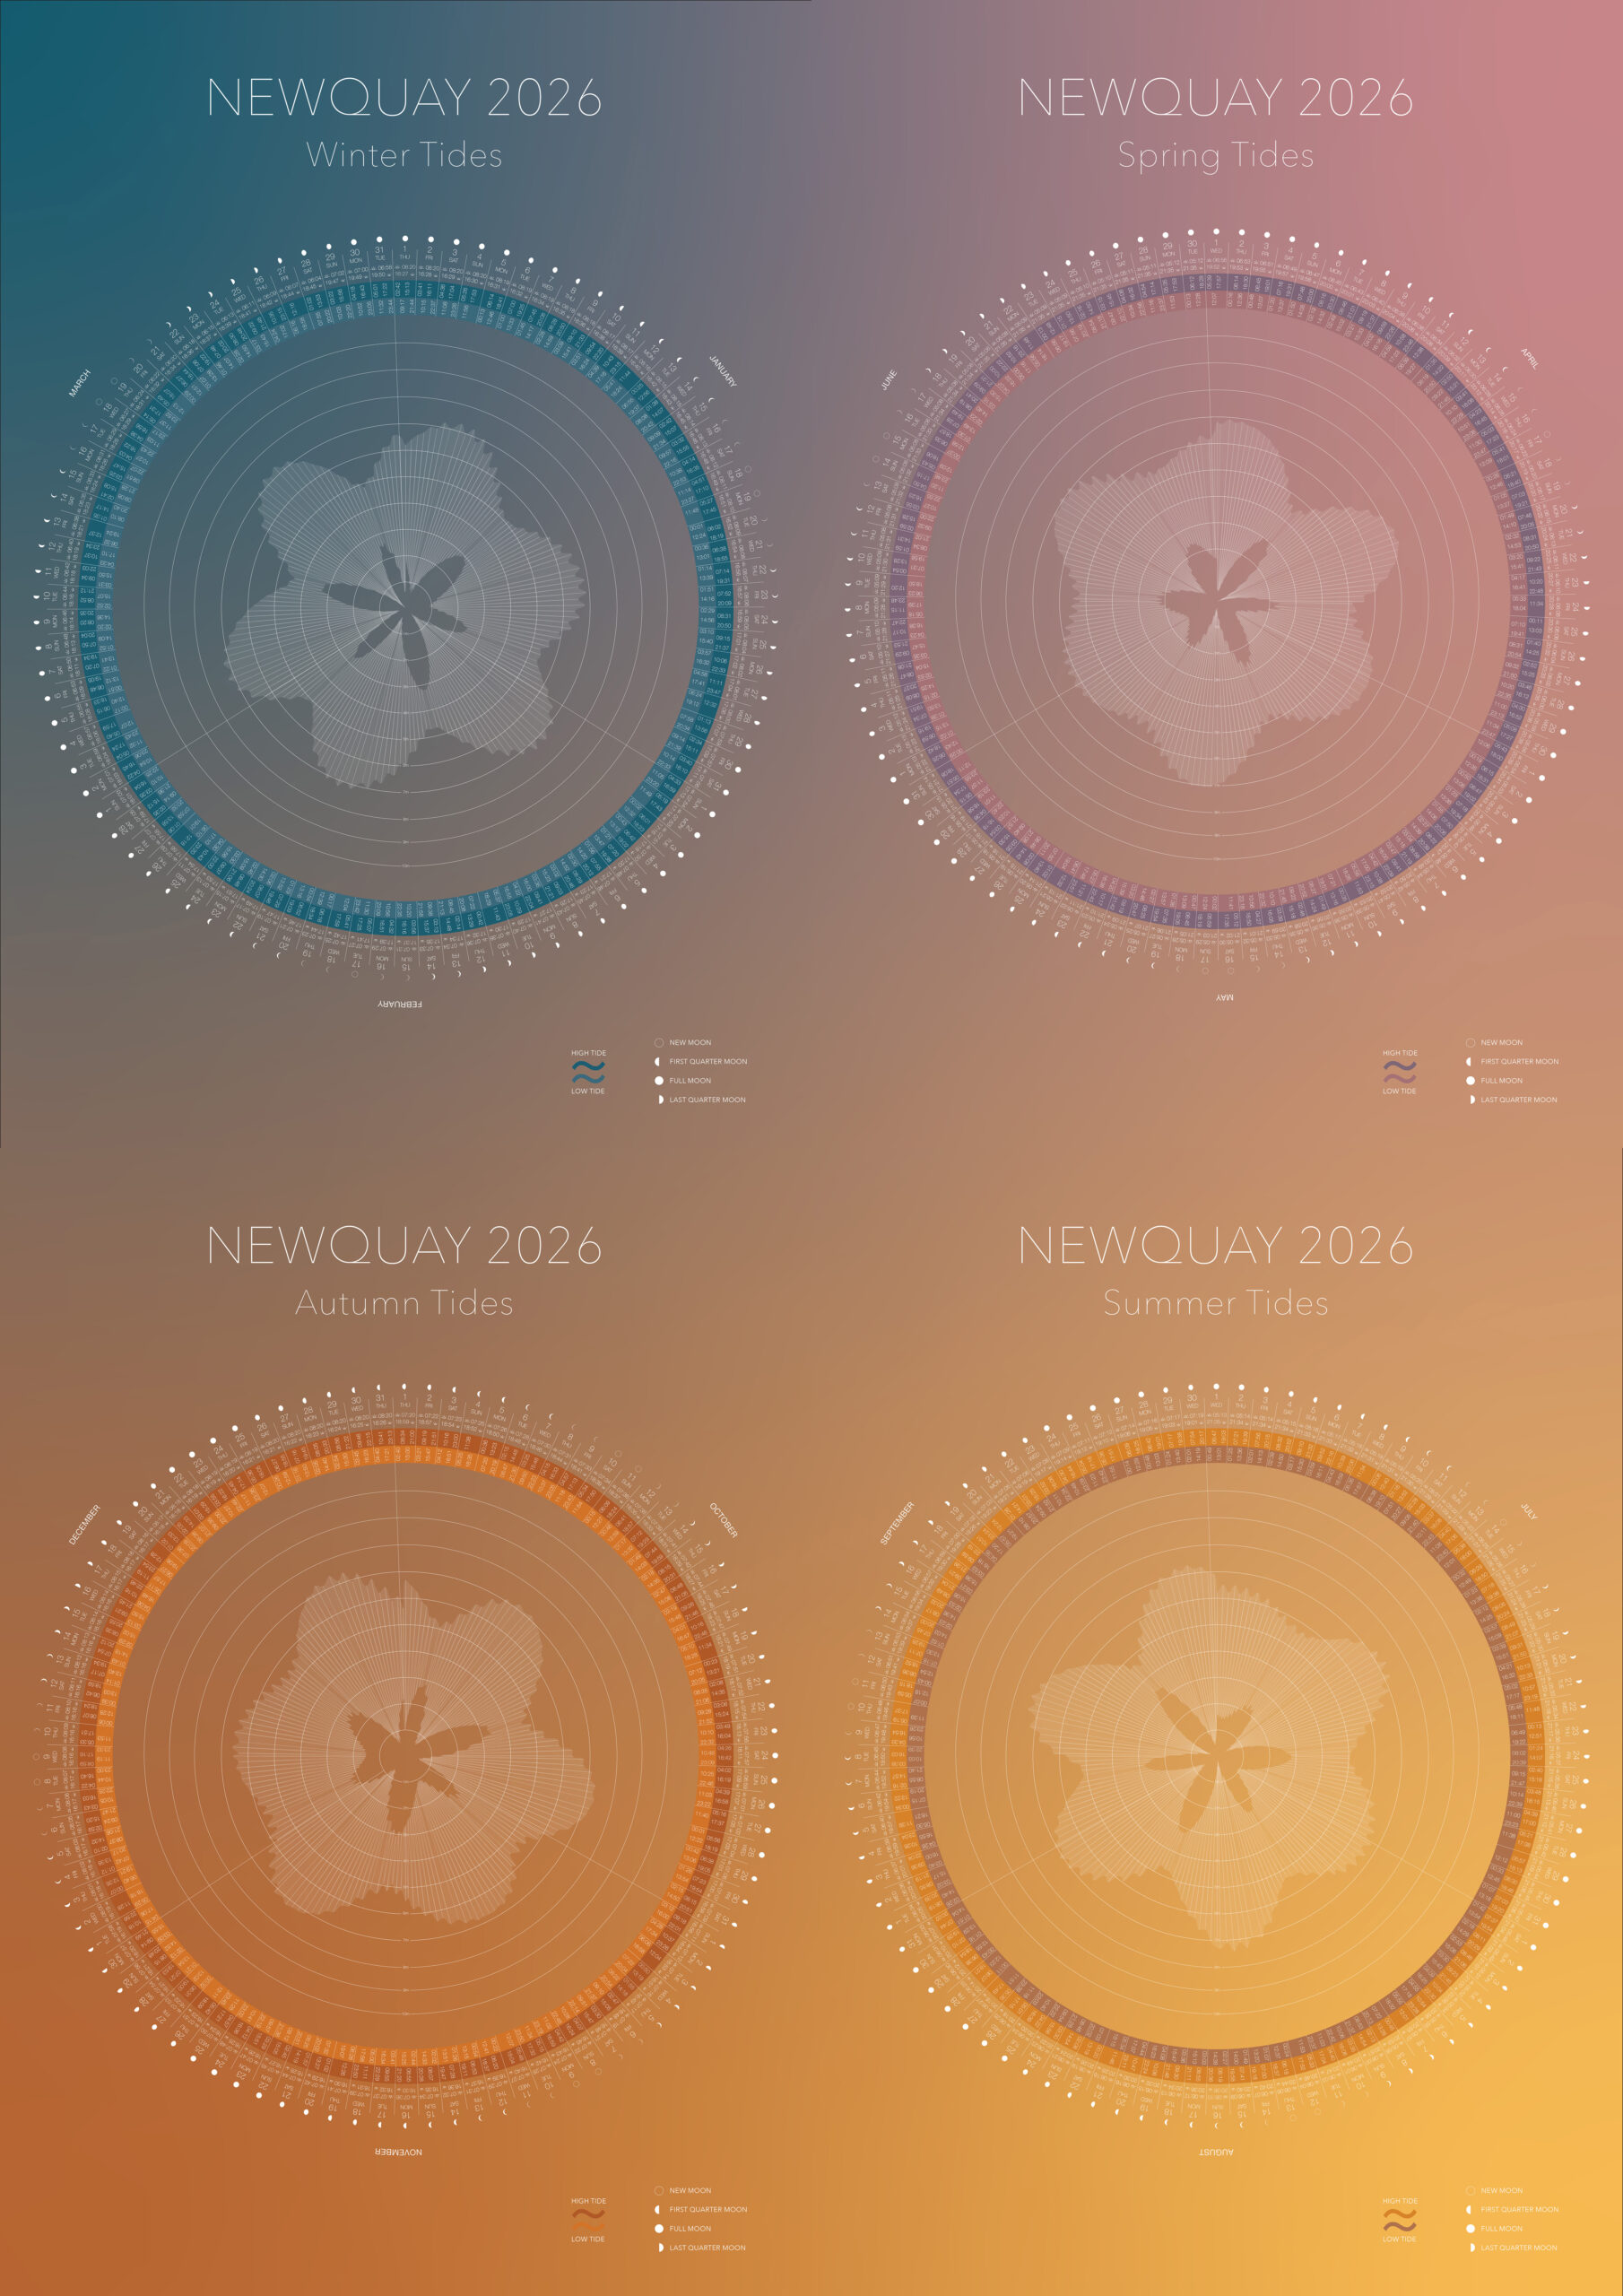
Tide times, moon phases, daylight hours, and tide heights at a glance. An intuitive infographic to help plan your costal adventures.